Contact us to learn more about
this development project
AdOps Reporting Dashboard Case Study
A leading video AdTech company partnered with Clearcode to design and build its proprietary AdOps reporting dashboard.
Below we outline the business use case, technical requirements of the project, main technical challenges, and the tech stack we used to build the reporting dashboard.
CLIENT
Tech company
INDUSTRY
Programmatic advertising
SERVICE
AdTech
COUNTRY
United States
About the project
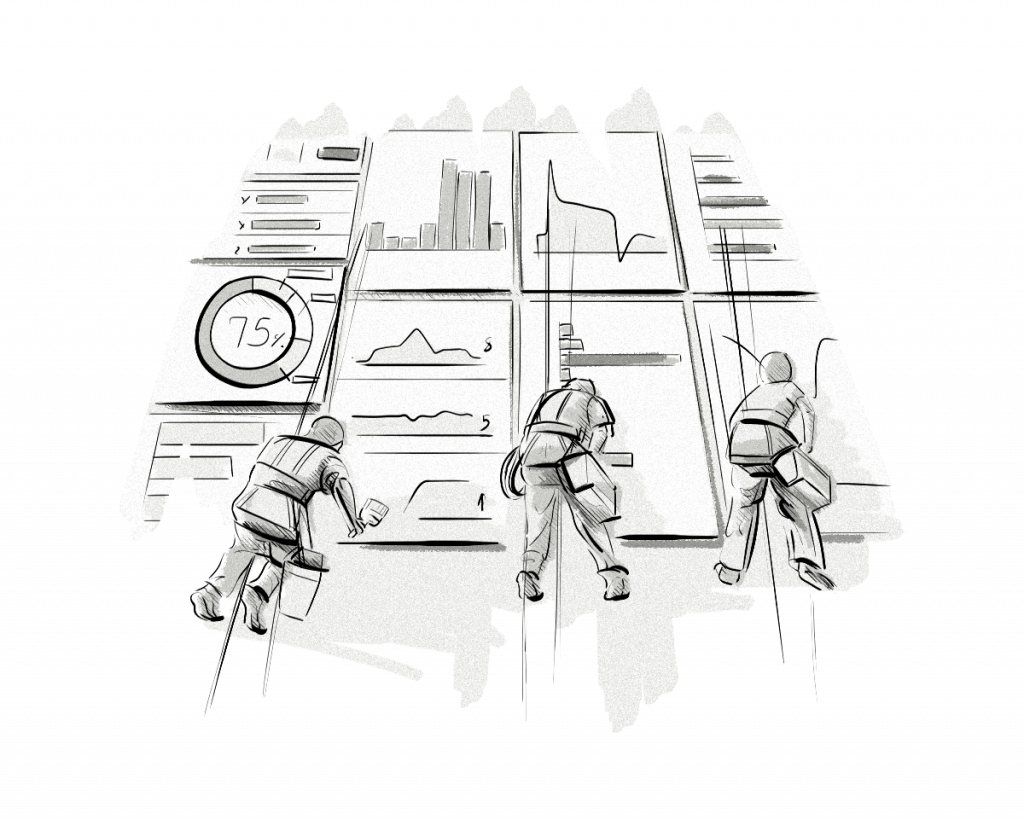
A leading video AdTech company partnered with us to build a reporting dashboard that would collect, aggregate, normalize, process, and visualize data from its ad mediator platform.
The ad mediator platform collects data from two separate data harvesters.
The data collected by these data harvesters would then be displayed on the reporting dashboard.
Key points
Product
We designed and built a reporting dashboard for a video AdTech company.
The reporting dashboard collects data from multiple sources and displays the metrics in the UI.
Business use case
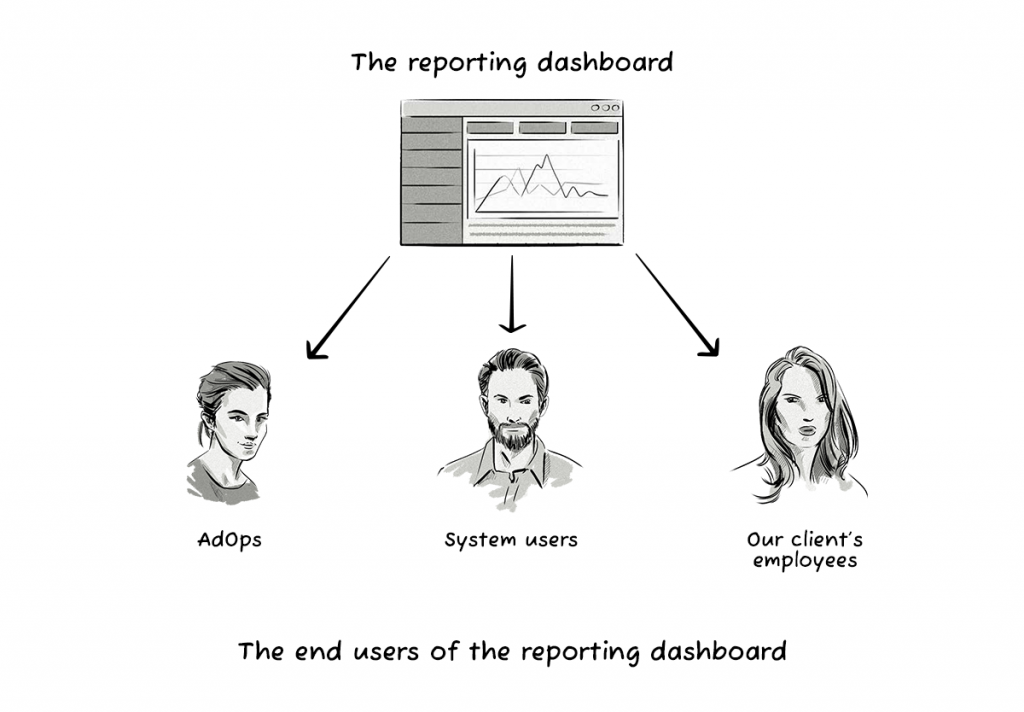
Our client wanted to build an AdOps reporting dashboard to provide additional value to its ad mediator platform by allowing its clients (publishers) to view campaign performance metrics and manage and control their inventory.
Main challenges
The main technical challenges were establishing a central aggregation point for the data sources, creating a component to handle and process the incoming data, and presenting the data in the UI in under 10 minutes.
Technologies
We built the reporting dashboard using AWS, JavaScript, Python, Terraforms, and Apache Spark.

“Our client wanted to build an AdOps reporting dashboard to provide additional value to its ad mediator platform.”
Beata Fil
PROJECT MANAGER AT CLEARCODE
Main challenges
The main challenge here was to compute and aggregate the metrics, and then display them on the reporting dashboard.
Another important challenge was to create an infrastructure that is easy to implement and update.
Part of the application required containerization. To solve this, we utilized Docker.
Main challenges & solutions
Below are the main technical challenges we faced and how we solved them.
Computing and displaying the metrics
Challenge: Compute and aggregate the metrics, and then display them on the reporting dashboard.
The metrics had to be computed from the raw header bidding transaction logs, which were dumped by the client’s system in Amazon S3s buckets.
Also, the files were of various sizes and contained various types of logs, which meant they had to be processed so we could display the metrics on the reporting dashboard.
Solution: We used Apache Spark for data processing and PostgreSQL for storing the aggregated metrics.
We ran Apache Spark on Amazon EMR and PostgreSQL on Amazon RDS, which allowed us to meet the low latency requirement for delivering metrics to the reporting dashboard and provide quick and easy filtering and displaying options.
Infrastructure
Challenge: Create an infrastructure that is easy to implement and update.
Solution: We used Terraform, which allows us to easily create a new infrastructure and change existing ones.
Containerization
Challenge: Part of the application required containerization.
Solution: We launched a Kubernetes cluster (Amazon EKS), which facilitates its management and further development in the future.
The technologies we used
AWS

JavaScript

Python
Apache Spark
Terraform
The result
Our client received a ready-to-use platform that meets the project’s
requirements.
Publishers can get better insights into the performance of their inventory, view the performance of their demand partners, and filter reports by demand partners, devices, and time intervals.